Static cash flow charts provide a fixed, straightforward snapshot of financial data, making it easy to understand basic inflows and outflows at a glance. Interactive cash flow dashboards offer dynamic visualization tools that allow users to filter, drill down, and analyze specific time periods or categories in detail. These dashboards enhance decision-making by delivering real-time insights and customizable views that adapt to changing financial conditions.
Table of Comparison
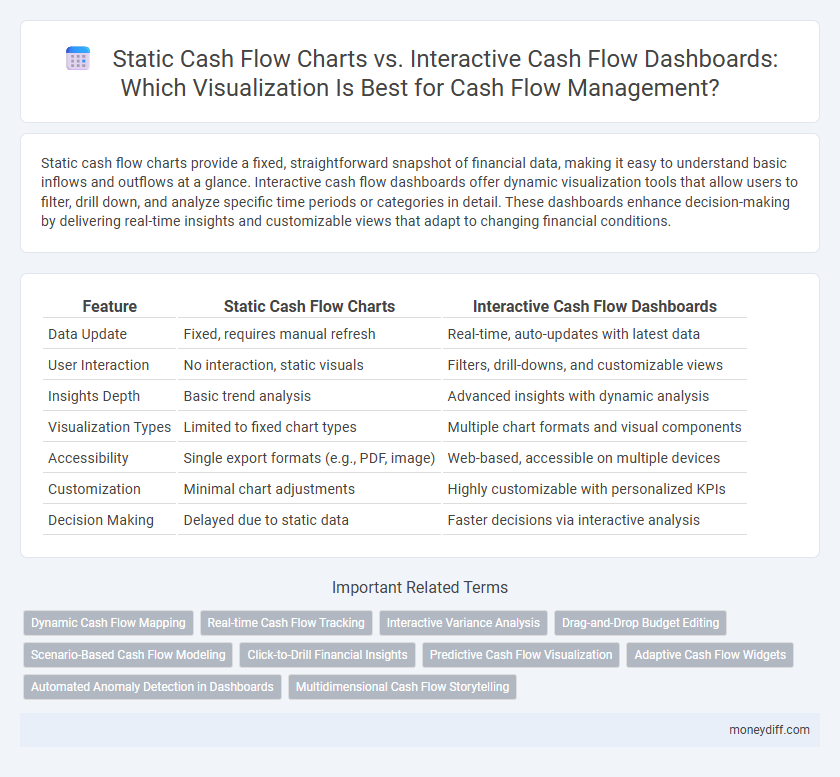
| Feature | Static Cash Flow Charts | Interactive Cash Flow Dashboards |
|---|---|---|
| Data Update | Fixed, requires manual refresh | Real-time, auto-updates with latest data |
| User Interaction | No interaction, static visuals | Filters, drill-downs, and customizable views |
| Insights Depth | Basic trend analysis | Advanced insights with dynamic analysis |
| Visualization Types | Limited to fixed chart types | Multiple chart formats and visual components |
| Accessibility | Single export formats (e.g., PDF, image) | Web-based, accessible on multiple devices |
| Customization | Minimal chart adjustments | Highly customizable with personalized KPIs |
| Decision Making | Delayed due to static data | Faster decisions via interactive analysis |
Understanding Static Cash Flow Charts
Static cash flow charts provide a fixed snapshot of cash inflows and outflows over a specified period, enabling straightforward analysis of historical financial performance. These charts simplify the visualization process by displaying data in consistent formats such as bar graphs or line charts, but they lack the ability to drill down into specific transactions or adjust parameters dynamically. Understanding static cash flow charts is essential for identifying basic trends and seasonal patterns, though they may limit real-time decision-making due to their non-interactive nature.
What Are Interactive Cash Flow Dashboards?
Interactive cash flow dashboards are dynamic visualization tools that allow users to explore real-time financial data through customizable charts, filters, and drill-down features. Unlike static cash flow charts, these dashboards enable detailed analysis of cash inflows and outflows by various dimensions such as time periods, departments, or projects. This interactivity enhances decision-making by providing a comprehensive and easily accessible view of the organization's cash flow health.
Key Differences: Static Charts vs Interactive Dashboards
Static cash flow charts present fixed snapshots of financial data, offering simplicity and ease of printing but limited user engagement and adaptability. Interactive cash flow dashboards enable dynamic exploration, real-time updates, and detailed drill-downs, enhancing decision-making through customized views and immediate data manipulation. The key differences lie in user interactivity, data refresh capability, and the depth of insight provided for effective cash flow management.
Visual Clarity: Comparing Static and Interactive Representations
Static cash flow charts offer a clear, straightforward snapshot of financial data, emphasizing simplicity and ease of interpretation without user interaction. Interactive cash flow dashboards enhance visual clarity by allowing dynamic filtering, zooming, and real-time updates, thereby providing deeper insights and tailored analysis. The choice between static charts and interactive dashboards depends on the need for either quick overviews or detailed, customizable exploration of cash flow trends.
Customization and User Engagement
Static cash flow charts offer limited customization, presenting fixed data views that restrict user interaction and adaptability to specific analysis needs. Interactive cash flow dashboards enable dynamic data exploration through customizable filters, real-time updates, and drill-down capabilities, significantly enhancing user engagement and decision-making accuracy. These dashboards support tailored visualizations that respond to individual user preferences and changing financial scenarios, making them essential for comprehensive cash flow management.
Real-Time Data Refresh and Updating Capabilities
Static cash flow charts provide a fixed snapshot of financial data without the ability to update in real-time, limiting responsiveness to market changes. Interactive cash flow dashboards offer dynamic visualization with real-time data refresh, enabling immediate insight into cash positions and trends. The updating capabilities of interactive dashboards support proactive cash management and faster financial decision-making.
Accessibility and User-Friendliness
Static cash flow charts provide straightforward visualization but often lack accessibility features and limit user interaction, making it difficult for users to explore detailed data. Interactive cash flow dashboards enhance accessibility by enabling dynamic filtering, zooming, and drill-down capabilities, which improves user-friendliness and supports more informed financial decision-making. These dashboards typically incorporate responsive design and keyboard navigation, ensuring a better experience for diverse users including those with disabilities.
Use Cases: When to Choose Static Over Interactive
Static cash flow charts provide clear, simplified snapshots ideal for quick presentations and printed reports where data consistency and ease of distribution are priorities. Interactive cash flow dashboards excel in exploratory analysis and real-time decision-making by enabling users to drill down into detailed transactional data and filter by periods or categories. Choose static charts when audience access or technology constraints limit interactivity, and opt for interactive dashboards to empower financial teams with dynamic insights for strategic cash management.
Limitations and Challenges of Each Approach
Static cash flow charts offer simplicity and clarity but lack real-time updates and interactivity, limiting their usefulness for dynamic financial analysis. Interactive cash flow dashboards provide comprehensive, real-time data visualization and customizable insights, yet they require higher technical expertise, increased development time, and may incur greater costs. Both approaches face challenges in balancing usability, data complexity, and the ability to convey detailed financial trends effectively to diverse stakeholders.
Choosing the Right Visualization for Effective Cash Flow Management
Static cash flow charts provide a straightforward snapshot of financial inflows and outflows, ideal for quick analysis or reporting purposes; however, they lack the dynamic capacity to explore data trends over time. Interactive cash flow dashboards offer real-time data updates, customizable views, and drill-down capabilities that empower users to identify patterns, forecast cash positions, and make informed decisions swiftly. Selecting the appropriate visualization depends on the complexity of cash flow data and the need for interactivity, with dashboards being preferable for ongoing management and static charts suitable for high-level summaries.
Related Important Terms
Dynamic Cash Flow Mapping
Static cash flow charts provide a fixed snapshot of financial inflows and outflows, limiting the ability to analyze trends or adjust views in real time. Interactive cash flow dashboards enable dynamic cash flow mapping, allowing users to filter data, drill down into specific periods, and visualize cash position changes instantly for more informed decision-making.
Real-time Cash Flow Tracking
Interactive cash flow dashboards provide real-time cash flow tracking with dynamic data updates and customizable visual elements, enhancing immediate decision-making accuracy. Static cash flow charts lack real-time data integration, offering limited insights and outdated financial information that can delay critical cash management responses.
Interactive Variance Analysis
Interactive cash flow dashboards enable dynamic variance analysis by allowing users to drill down into specific cash inflows and outflows, facilitating real-time scenario adjustments and trend identification. Unlike static cash flow charts, these dashboards provide customizable filters and visual cues, improving accuracy in forecasting and enhancing decision-making efficiency for financial management.
Drag-and-Drop Budget Editing
Static cash flow charts provide fixed visual representations of financial data, limiting user interaction and real-time updates, whereas interactive cash flow dashboards enable drag-and-drop budget editing, allowing dynamic adjustments and instant visualization of cash flow impacts. This interactive feature enhances financial planning accuracy by facilitating scenario analysis and streamlined budget management within the dashboard environment.
Scenario-Based Cash Flow Modeling
Static cash flow charts provide fixed, one-dimensional snapshots of cash movement, limiting the ability to assess various financial scenarios or adapt forecasts dynamically. Interactive cash flow dashboards enable scenario-based cash flow modeling by allowing users to manipulate variables in real-time, enhancing decision-making accuracy and enabling proactive financial planning.
Click-to-Drill Financial Insights
Static cash flow charts provide a fixed, snapshot view of financial data, limiting the ability to explore underlying details, whereas interactive cash flow dashboards enable dynamic click-to-drill functionality for deeper financial insights. These dashboards enhance decision-making by allowing users to pinpoint cash inflows and outflows at granular levels, improving accuracy in cash management and forecasting.
Predictive Cash Flow Visualization
Static cash flow charts provide a fixed snapshot of historical financial data, limiting the ability to anticipate future trends or identify cash flow anomalies in real-time. Interactive cash flow dashboards leverage predictive analytics and dynamic visualizations to enable proactive cash management, offering scenario-based forecasting and instant insights into future liquidity positions.
Adaptive Cash Flow Widgets
Adaptive Cash Flow Widgets enhance visualization by providing dynamic, interactive dashboards that update in real-time, enabling deeper analysis of cash flow trends compared to static cash flow charts. These widgets allow users to customize views, filter data, and drill down into specific periods or categories, optimizing decision-making and financial planning efficiency.
Automated Anomaly Detection in Dashboards
Interactive cash flow dashboards enhance financial analysis by incorporating automated anomaly detection algorithms that identify irregular cash inflows or outflows in real-time, enabling quicker response to potential issues. Static cash flow charts lack this dynamic monitoring capability, limiting their usefulness for timely financial decision-making.
Multidimensional Cash Flow Storytelling
Static cash flow charts provide a fixed, single-dimensional snapshot of financial data, limiting the depth of analysis and the ability to explore underlying trends or anomalies. Interactive cash flow dashboards enable multidimensional cash flow storytelling by allowing users to drill down into various financial metrics, compare periods dynamically, and visualize cash inflows and outflows across different departments or projects for more comprehensive decision-making.
Static cash flow charts vs Interactive cash flow dashboards for visualization. Infographic